

Aviv Amirav, Professor of Chemistry at Tel Aviv University and Director - Aviv Analytical
Introduction
Glycidyl fatty acid esters (Glycidyl Esters or GE in short) have the general structure as shown for Glysydyl stearate below.
 |
| Glysydyl Stearate |
Glycidyl esters are of concern as they may occur in refined edible fats and oils and corresponding finished food products, including infant formula. The toxicological relevance of glycidyl esters is just as unclear as the question of their hydrolysis within the human digestive tract. Glycidol itself – the epoxide of glycerol - has carcinogenic and mutagenic features. The German Federal Institute for Risk Assessment (BFR) presently assumes that glycidol is fully released for glycidol esters in the digestive tract. In addition, Glydidyl esters are also linked with the appearance of the highly toxic 3-Monochloro-1,2-propanediol (3-MCPD) in various types of food, Thus, it is important to identify glycidyl esters in food. However, the analysis of Glycidyl esters can be problematic as they are known to be thermally labile and also having a weak or completely absent molecular ions in their EI mass spectra. At the recent 2012 Capillary Chromatography meeting in Riva del Garda, Sjaak de Koning, Herrald Steenbergen, and Hans-Gerd Janssen presented their work on the analysis of glycidyl esters while using the Leco Pegasus HT GC-TOF-MS.

In their work, no molecular ion was observed as shown above. We believe that without having molecular ions one cannot and should not trust that these thermally labile compounds actually eluted as these mass spectra can correspond to injector or transfer line degradation or on-the-shelf degradation products. In addition, with abundant m/z=116 ion and weak m/z=185 ion in the EI mass spectra the selectivity of glydidyl esters analysis with such low mass fragment ions in complex food matrices is expected to be limited.
Thus, motivated by this challenge and after discussing it with Dr. Hans-Gerd Janssen from Unilever we decided to analyze glycidyl esters using the 5975-SMB GC-MS with Cold-EI, and our results are reported in this post.
Thus, motivated by this challenge and after discussing it with Dr. Hans-Gerd Janssen from Unilever we decided to analyze glycidyl esters using the 5975-SMB GC-MS with Cold-EI, and our results are reported in this post.
GC-MS with Cold EI Analysis of Glycidyl Esters
The Aviv Analytical 5975-SMB GC-MS with Cold EI provides a unique opportunity to analyze Glycidyl Esters including at trace levels. For further information on GC-MS with Cold EI please refer to A. Amirav, A. Gordin, M. Poliak, and A. B. Fialkov "Gas Chromatography Mass Spectrometry with Supersonic Molecular Beams" J. Mass. Spectrom. 43, 141-163 (2008). One of the main features of the Aviv Analytical 5975-SMB GC-MS with Cold EI is that it provides enhanced molecular ions which could be abundant for all compounds. Furthermore, extended range of compounds are amenable for analysis with the 59755-SMB system to include low volatility and thermally labile compounds that cannot be analyzed by standard GC-MS. In addition, the 5975-SMB GC-MS enables much shorter analysis times and improved sensitivity and selectivity on the molecular ions.
The Glycidyl Esters sample
We received from our supplier by standard "snail" mail one vial with the following compounds in the form of dry material: 1) glycidyl laurate (MW=256); 2) glycidyl myristate (MW=284); 3) glycidyl palmitate (MW=312); 4) glycidyl stearate (MW=340); 5) glycidyl oleate (MW=338); 6) glycidyl linoleate (MW=336) and 7) glycidyl linolenate (MW=334). The stated amount of these compounds was in the 15-20 µg each while the linolenate was at 33 µg (A vial with these compounds in a solvent was dried and sent). The vial was filled by us with 500 µL of hexane and formed glycidyl esters mixture at the concentration range of 30-40 ppm for the first 6 compounds. We analyzed them with split injection using split ratio of 5 thus having 6-8 ng on-column of these compounds. In addition, we also diluted this mixture 1000 times in hexane to have the glycidyl esters at the 6-8 pg on-column amounts for the evaluation of the system sensitivity in single ion monitoring mode.
Analytical conditions summary:
System: 5975-SMB GC-MS with Cold EI system of Aviv Analytical based on the combination of an Agilent 5975 MSD with the Aviv Analytical supersonic molecular beam interface and its unique fly-through ion source.
Injection: 1 µL at 180ºC with split ratio 5. Pulsed split injection was used with 50 PSI injector pressure for 0.3 minutes. It resulted in 42 ml/min column flow rate during injection. The relatively low injector temperature served to suppress sample degradation at the injector while the high column flow rate during injection served to effectively transfer the sample compounds to the column despite the relatively low injector temperature.
Sample: Glycidyl Ester mixtures as described above.
Column: 5 m, 0.25 mm ID, 0.25µ film DB-5MS UI
He column flow rate: 5 ml/min with flow program of 8 ml/min•min after 6 minutes to 16 m/min (to improve the column cleaning). The combination of short column and high, 5 ml/min column flow rate resulted in lower elution temperature of these compounds (all eluted below 200ºC) thereby eliminated their on-column degradation.
Oven: 50ºC followed by 30ºC/min to 280ºC and 1.3 min hold for total of 9 min.
Cold EI Source: 12 mA emission, 70 eV electron energy, 56 ml/min He makeup flow.
SMB transferline temperature: 200ºC for 5 min followed by temperature program of 10 ºC/min to 250ºC. Transfer line temperature program is another tool to reduce degradation of labile compounds prior to their entry to the ion source.
5975 mass range: 50-500 amu at about 3.2 Hz full scan frequency. SIM experiments were performed at m/z=340.3 the molecular ion of glycidyl stearate with dwell time of 500 msec.
Results – Glycidyl Esters Analysis
As shown in Figure 1a, the full scan total ion count (TIC) mass chromatogram of the glycidyl esters mixture exhibits five main peaks plus a few minor additional peaks. Figures 1b and 1c show the Cold EI mass spectra of glycidyl laurate (MW=256) at 3.5 min elution time, glycidyl myristate (MW=284) at 4.13 min elution time, glycidyl palmitate (MW=312) at 4.73 min elution time, glycidyl oleate (MW=338) eluting at 5.21 min (which co-eluted with glycidyl linoleate (MW=336) with Cold EI MS shown in Figure 2 and glycidyl stearate (MW=340) at 5.3 min elution time. These Cold EI mass spectra are shown in order of elution and as observed each of them exhibited its molecular ion as the highest mass spectral peak plus a few high mass characteristic fragments. As further observed, the relative abundance of the molecular ions increased with the size of the glycidyl ester and it was as high as 70% for glycidyl stearate. We used a DB-5MS UI column only due to availability and with this column we had partial coelution of the unsaturated glycidyl oleate and glycidyl linoleate esters. In Figure 2 we show the Cold EI mass spectrum of glycidyl linoleate which is still mixed with some contribution of glycidyl oleate. In order to observe the exact elution time and relative intensity of the molecular ions of glycidyl stearate and all its unsaturated acid esters members we plotted in figure 3 the reconstructed single ion mass chromatograms (RSIM) of ions with m/z= 340.3, 338.3, 336.3 and 334.3 (molecular ions). As shown, the glycidyl linoleate coeluted with glycidyl oleate at the early elution time side of the peak and its intensity was a quarter of that of the glycidyl oleate while the intensity of glycidyl linolenate molecular ion at m/z=334.3 was only 2.5% of that of m/z=340.3 of the saturated glycidyl stearate. Clearly, we had a problem with the sample in that its chemically active unsaturated glycidyl esters were oxidized during their drying and/or shipment to Tel Aviv and the larger the degree of unsaturation the greater is their reactivity. In figure 4 we provide a supporting evidence to the assumption of unsaturated esters oxidation in the averaged mass spectrum of the several small peaks eluting at the 5.6-6.4 min time window. As shown, the average mass spectrum exhibits m/z=350.4 and 352.3 among a few other Cold EI MS peaks which hints to the addition of oxygen and or water to the unsaturated esters. Since we have molecular ions in Cold EI and these ions are the most selective against matrix interference we tested the 5975-SMB system sensitivity on the molecular ion of glycidyl stearate. In figure 5 we show the SIM trace of 6.6 pg on-column glycidyl stearate (33 ppb glycidyl stearate solution injected with split 5). The Chemstation calculated signal to noise ratio while selecting noise at the 2-3 min time window is 1750 (RMS) and 500 in peak to peak and when the noise is selected after the compound elution the signal to noise ratio was 560 (RMS) and 160 in peak to peak. Thus, mid-low femtogram range LOD can be extrapolated for the glycidyl esters with the Aviv Analytical 5975-SMB GC-MS with Cold EI.
Finally, in comparison with standard EI mass spectra as obtained by the Leco Pegasus GC-TOF-MS, clearly the 5975-SMB results are far superior as the Cold EI mass spectra exhibit molecular ions plus characteristic high mass fragments which help in the identification process, lower the LOD and help to reduce matrix interference. In addition, the chromatography time was about twice faster with the 5975-SMB.
 |
| Figure 1a. Full scan total ion count mass chromatogram of the glycidyl esters mixture |
 |
| Figure 1b. Cold EI mass spectra of glycidyl laurate (MW=256) at 3.5 min elution time, glycidyl myristate (MW=284) at 4.13 min elution time and glycidyl palmitate (MW=312) at 4.73 min elution time |
 |
| Figure 1c. Cold EI mass spectra of glycidyl oleate (MW=338) and glycidyl linoleate (MW=336) coeluting at 5.21 min elution time and glycidyl stearate (MW=340) at 5.3 min elution time. |
 |
| Figure 2. Cold EI mass spectrum of glycidyl linoleate which is mixed with some contribution of co-eluting glycidyl oleate. |
 |
| Figure 3. Reconstructed single ion mass chromatograms (RSIM) of ions with m/z= 340.3, 338.3, 336.3 and 334.3. As shown, the glycidyl linoleate coelute with glycidyl oleate at the early elution time side of the peak and its intensity is a quarter of that of the glycidyl oleate while the glycidyl linolenate molecular ion at m/z=334.3 intensity is only 2.5% of that at m/z=340.3 of the saturated glycidyl stearate. |
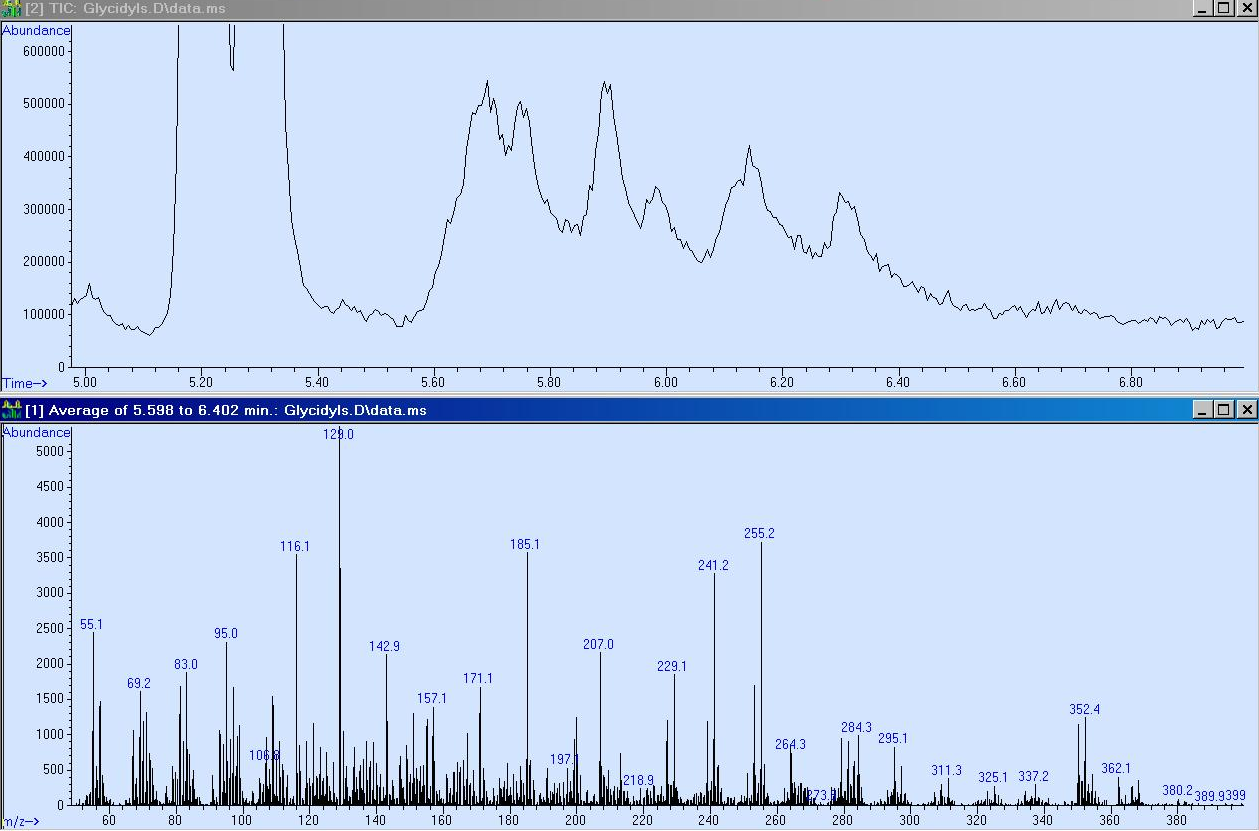 |
| Figure 4. Total ion count mass chromatogram (upper trace) of oxidation products of unsaturated glycidyl esters in the elution time window 5-6.8 minutes and Cold EI mass spectrum averaged at the 5.6-6.4 min time window. As shown, the averaged mass spectrum exhibits m/z=350.4 and 352.3 among a few others peaks which hints to the addition of oxygen and or water to the unsaturated esters. |
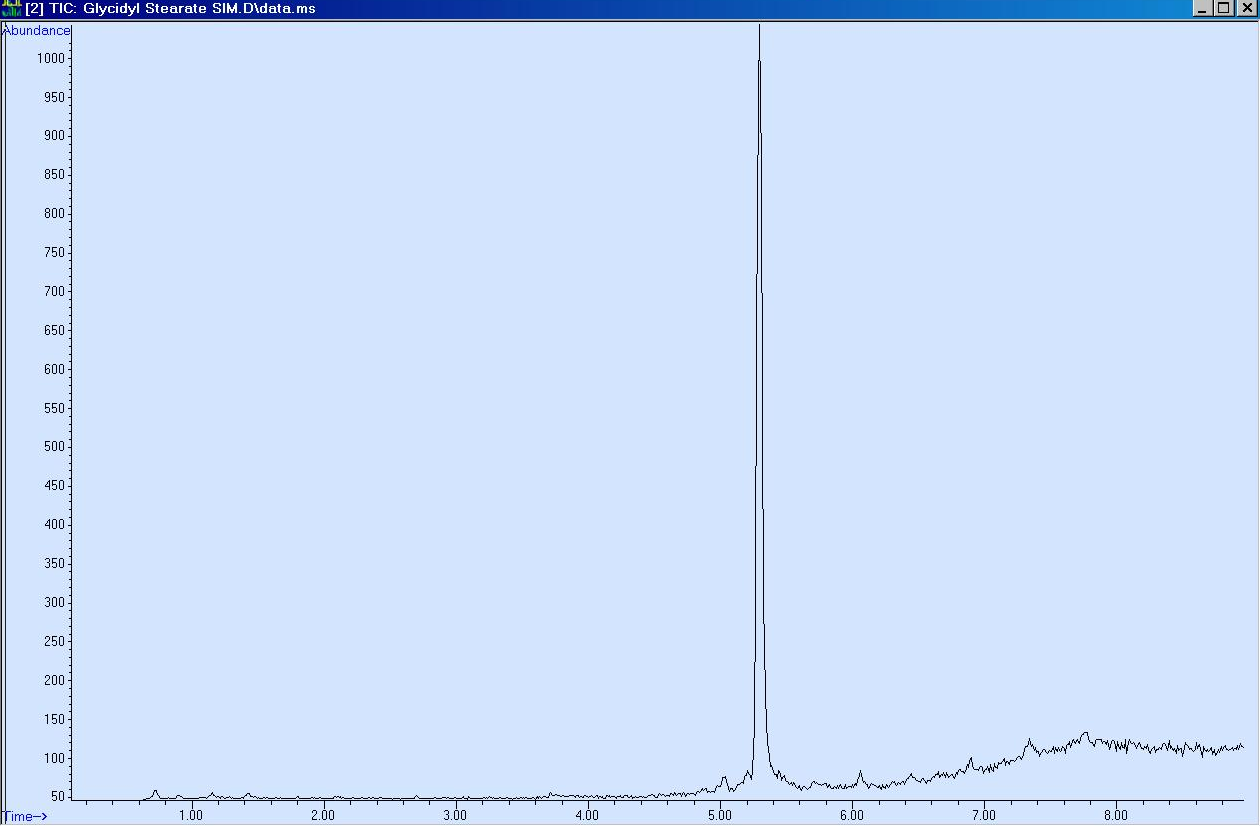 |
| Figure 5. SIM trace of 6.6 pg on-column of glycidyl stearate using its molecular ion at m/z=340.3. |
No comments:
Post a Comment