

Aviv Amirav and Svetlana Tsizin, Tel Aviv University and Aviv Analytical, Tel Aviv Israel.
Gabi Shefer, Ichilov hospital Tel Aviv Israel
Introduction
Cholesterol and triglycerides analysis in human blood is among the most widely used chemical medical diagnostics tests. Some estimate the number of such analysis at 1 Billion/year with cost of about $30 for each analysis (three analyses of cholesterol LDL, HDL and triglycerides at $10 each). Thus, the total lipids in blood analysis market is about $30 Billion/year. However, current analysis brings limited information and mass spectrometry can provide far better and more detailed lipids in blood information if an appropriate instrument for such analysis will be available. We used our GC-MS with Cold EI and demonstrated as below the analysis of large range of lipids in blood. Each analysis provided information on the amount of several free fatty acids, cholestadiene, cholesterol, vitamins E and 25 Hydroxy vitamin D3 and many diglycerides, cholesteryl esters and triglycerides. Notably, we can clearly distinguish differences among samples from different people. Each analysis took only 10 min via the use of column flow programing. Our results yielded extensive lipidomics information that may include new diagnostic tools. We feel that this new and advantageous assay for lipids profiling in blood is worthy of further investigation and evaluation.
GC-MS with Cold EI System: An Aviv Analytical 5975-SMB GC-MS with Cold EI system was employed, based on the combination of an Agilent 7890A-5975 GC-MSD with the Aviv Analytical supersonic molecular beam interface and its fly-through ion source. The system used has a six years old fly-through ion source that was never serviced and which still uses its original filament and ion cages.
Samples: Greater than 20 serum samples were provided by Ichilov Tel Aviv hospital, among which 4 were analyzed so far for this application note.
Sample preparation: We followed the Folch method. Methanol (1.5 ml) was added to 200μl of serum and vortexed. Then, 3ml of CHCl3 were added and put in a shaker for 1 h. Then 1.25ml of water were added for phase separation. The lower phase was separated and the upper was washed with 2ml of CHCl3/methanol/water mixture, (86:14:1, v/v/v). After combining the organic phases the sample was centrifuged and the clear part was separated and dried. The residue was dissolved in 200µl of CHCl3. The full sample preparation took about 3 hours and in a batch many samples could be processed together at the same time. A batch of 20 samples could be prepared in about 3 hr, but this procedure could be further streamlined.
Injection: 1 µL splitless at 320ºC with split valve opened at 0.5 min.
Column: Agilent DB1HT of 15 m, 0.32 mm ID, 0.1 µm film.
He column flow rate: 8 ml/min for 5 min and then flow program up at 8 ml/min.min to 30 ml/min column flow rate and hold at 30 ml/min for 2.25 min. Only Cold EI allows such high flow rates in GC-MS without loss of performance to elute the triglycerides so quickly. The alternate use of a higher GC oven temperature of 380°C resulted in higher column bleed, thus max column temperature of 350°C with flow programming was preferred.
Oven: 60ºC initial temperature immediately ramped at 40ºC/min to 350ºC and held until 10 min (this is very fast in the GC analysis of such large molecules).
Cold EI Source: 7 mA emission, 70 eV electron energy and 60 mL/min combined He makeup gas plus column flow.
Transfer line temperatures: 280ºC for 4 min followed by temperature program at 20°C/min to 340°C and held for 3 min.
Mass spectral range and scan speed: m/z 50-1000 at about 3 Hz scan frequency.
Summary of the results
Cold EI demonstrated its usefulness in the following aspects:
- All the diglycerides, cholesteryl esters and triglycerides were eluted in 10 min using Cold EI GC-MS. They all exhibited good peak shapes without any ion source tailing, while achieving excellent sensitivity and high ratio of peaks to column bleed.
- Cold EI provided molecular ions information for all lipids. The Cold EI mass spectra of each triglyceride exhibited useful molecular ions with relative abundances of 10-50% to the base peak. Molecular ions are not only important for the elucidation of the structure of the triglycerides but it also helped to resolve co-eluting saturated and unsaturated triglycerides in these triglycerides.
- Cold EI provided informative high mass fragment ions information. As a result, it is possible to more accurately obtain the structure of the diglycerides and triglycerides.
- Cold EI provided useful information about diglycerides that eluted among the cholesteryl esters. The Cold EI mass spectra of diglycerides were characterized by having abundant molecular ions plus a nearby high mass fragment of M-18 in view of loss of water. Cholesteryl esters Cold EI MS were characterized by a dominant m/z=368 fragment ion.
- The analysis time was merely 10 min.
- Caffeine was found at various concentrations in the samples, which indicates the ability to simultaneously monitor drugs in blood using the same method.
- Several free fatty acids were found. The most abundant were palmitic, linoleic, oleic and stearic but arachidonic acid and smaller free fatty acids were also found.
- Vitamin E was found, possessing only one major isomer of MW = 430 (alpha tocopherol).
- 25-Hydroxy Vitamin D3 was found, but we are not sure which isomer.
- Cholestadiene was found and its ratio to cholesterol could be measured.
- Cholesterol was the second biggest peak. Its relative and absolute concentration greatly varied between different samples by more than a factor of 3.
- Several diglycerides were found. In total, they were more abundant than the triglycerides. Chemically, they should be more active than triglycerides.
- Six cholesteryl esters were found. Cholesteryl esters were the most abundant lipids in the serum samples and among them cholesteryl C18 (linoleate, etc.) were the most abundant. We were surprised to find that the cholesteryl esters only consisted of multi unsaturated acids such as linoleic and arachidonic but none with palmitic acid or oleic acid. Probably the saturated CEs had very small molecular ions. CEs were more abundant than cholesterol by about a factor of 3-4 (sample dependent).
- The triglycerides were found with a mixture of acids. Accordingly, the molecular ions of the one with tri C18 consisted of a mixture of 0-8 degrees of unsaturation. The most abundant TAGs were with one C16 and two C18. Only small amount of tripalmitin (tri C16) was present despite palmitic acid being the most abundant free fatty acid in the serum.
 |
| Figure 1. Cold EI total ion mass chromatograms and Cold EI mass spectra of two human serum extracts. The names of the various compounds and compound families are indicated. Cold EI of a selected cholesteryl ester and triglyceride are shown to the right. Note the differences between the two human samples. |
 |
| Figure 2. Total ion mass chromatograms of serum zoomed at the elution time of free fatty acids and the Cold EI mass spectrum of linoleic acid. |
 |
| Figure 3. Total ion mass chromatogram of serum zoomed at the elution time of vitamin E and 25-hydroxy vitamin D3 and the Cold EI mass spectrum of vitamin E. |
 |
| Figure 4. Total ion mass chromatogram of serum zoomed at the elution time of diglycerides and the Cold EI mass spectrum of a diglyceride with molecular weight of 592. |
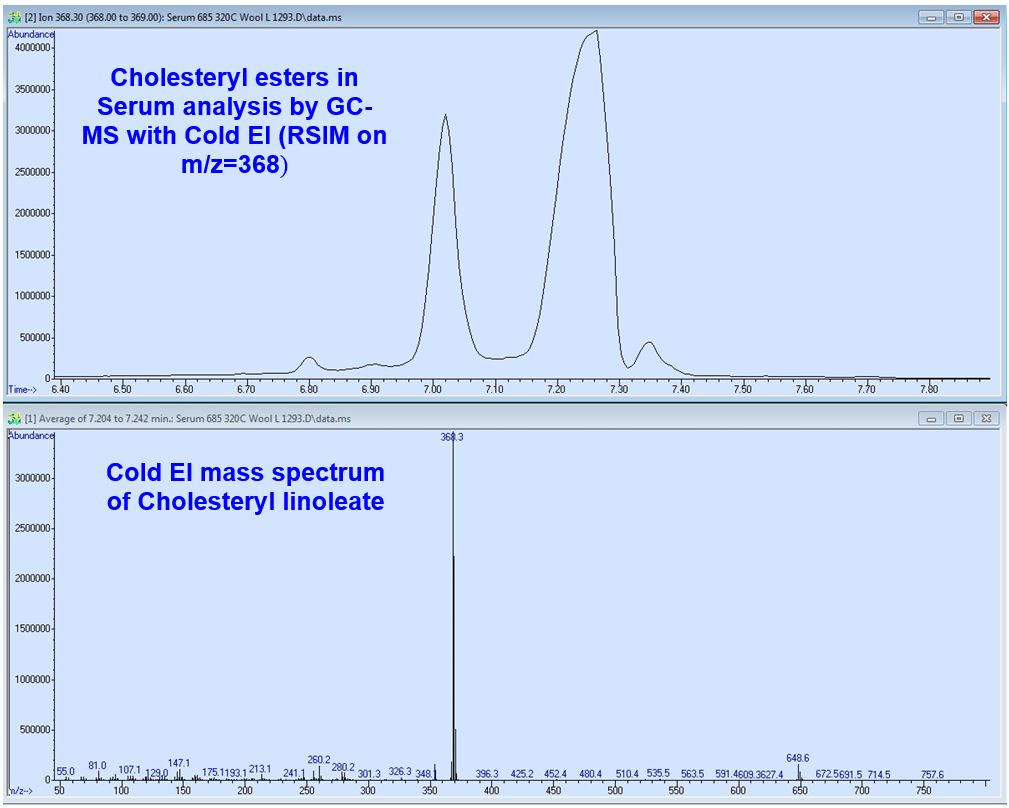 |
Figure 5. RSIM mass chromatogram with m/z = 368 of cholesteryl esters in serum zoomed at the elution time of cholesteryl esters and the Cold EI mass spectrum of cholesteryl linoleate.
|
 |
Figure 6. Total ion mass chromatogram of serum zoomed at the elution time of triglycerides and the Cold EI mass spectrum of glycerol tri C18 fatty acids mixture
|
 |
| Figure 7. Cold EI mass spectrum of a triglyceride GC peak of glycerol with three C18 fatty acids. Note the range of degrees of unsaturation from 0 to 8 (peaking at 4). |
No comments:
Post a Comment